This article is about an Excel model for calculating portfolio variance. When it comes to calculating portfolio variance with just two assets, life is simple. But consider a situation when there are 10, 15, maybe hundreds of assets. This brief article is a practical demonstration of how portfolio variance can be modeled in Excel – the underlying math, and an actual spreadsheet for your playing pleasure! Enjoy!
Calculating portfolio variance for a portfolio of two assets with a given correlation is a fairly trivial task – you use the formula  to get the portfolio variance, and take the square root to get the standard deviation or volatility. This formula is very useful in forming an intuitive understanding of how correlation affects risk, and examining various concepts relating to portfolio construction.
This formula is not really scalable to real life situations where a portfolio may consist of tens or hundreds of securities. What we really need for that is matrices, and Excel. This tutorial looks at how portfolio risk calculations can be modeled within Excel. You are unlikely to be asked to do this in the exam, in fact the multiple choice format is very poorly suited to testing such knowledge. Yet this is useful should you wish to see how this really would work in practice, or wish to test some additional ideas, for example, the impact of changing correlations on portfolio volatility.
The variance of a portfolio of correlated assets can be written as WTvW, where W is a column vector (ie a matrix with a single column) containing the weights of different assets in the portfolio. V is the covariance matrix, and WT is the transpose of the matrix W.
So for two assets, the combined variance of the portfolio can be written as follows in matrix notation:
 #1
#1
Where w1 to wn are the weights of assets 1 to n in the portfolio, and σxy is the covariance between assets x and y. Note that σ12 means the variance of asset 1, which is nothing but the covariance of the asset with itself.
In practice we rarely have the covariance matrix. What we generally get is the correlation matrix, which gives us the correlation between any two of the assets in the portfolio in the form of a matrix.
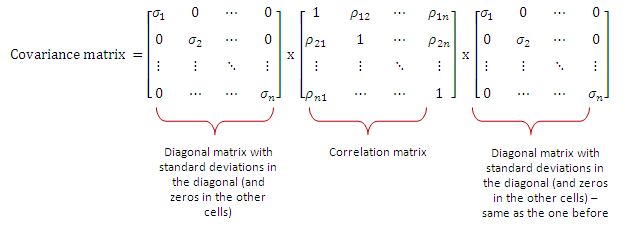
If ρ be the correlation between two assets, then we know that ρ(x,y) = covariance(x,y)/σx σy. Therefore if we know the correlation matrix between assets, we can calculate the covariance matrix as follows:

where ρxy is the correlation between assets x and y, and σn is the standard deviation of the nth asset.
We can substitute this expression for the covariance matrix in #1 above to get the portfolio variance.
Therefore portfolio variance


Matrices can be multiplied in Excel using the function MMULT, and because MMULT only takes two matrices as its arguments, we can nest a number of MMULTS within each other.
See the calculations in action – here is a sample spreadsheet with 6 assets for which the standard deviations and correlations are known. We can calculate the portfolio volatility for any set of weights, and also calculate the Sharpe Ratio. We can look at the effect of changing different variables on risk and return, and even calculate the efficient portfolio (I leave it to you as an exercise).
If possible, you should try constructing this spreadsheet yourself. It will clarify many concepts in a way that cannot be done from a mere reading of text.

Your comment is awaiting moderation.
Wonderful beat ! I would like to apprentice while you amend your web site, how can i subscribe for a blog site? The account aided me a acceptable deal. I had been tiny bit acquainted of this your broadcast provided bright clear concept